![NOCI logo.png]](https://knowledge-software.noc-innovations.com/hs-fs/hubfs/NOCI%20logo.png?height=50&name=NOCI%20logo.png)
Poltips-4 can present tidal data to you in a number of different ways such as raw data, formatted tide tables or tidal graphs. There are times when you may want to print these results.
Printing raw tidal data Poltips-4 does not directly support printing of raw tidal data since in most cases it is rare that you would want to do this in its entirety, and would often lead to a huge number of pages being produced. You can however easily save the data to file or copy it to the clipboard which would allow you to paste it directly into another program like Microsoft Word, Microsoft Excel or Notepad, which will give you more control over what you want printed and how.
Printing tide tables
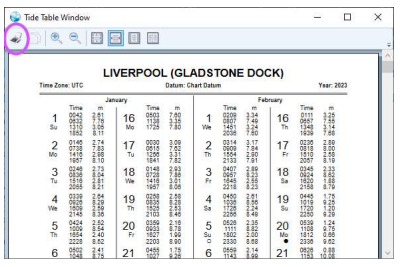
When you generate a formatted tide table this will automatically appear in a separate window inside what is called a document viewer. This allows accurate printing of exactly what you see in the document by simply clicking the printer icon on the toolbar. Note that when you print a tide table – it always prints the whole tide tables. If you only want a month or two of data, then just predict the exact period that you require and then you can print exactly what you need.
Printing graphs
The majority of users will never want to print a graph so there is no built-in capability to do this.
However, if you want to, you can easily capture the image of the graph inside the window using one of two methods that are built into Microsoft Windows:
- Alt + Print Screen will capture the currently selected window as an image in the clipboard. You can then simply paste this into your application of choice like Word or any graphics package. This will however retain the title of the window and the controls below the graph however these can be easily cropped out in most applications.
- The Windows Snipping Tool allows you to select any part of the screen precisely and either copy it to the clipboard or save it to an image file (such as a .PNG or .JPG file). There's plenty of information on the internet on using the Windows Snipping Tool. Google "Windows snipping tool" and you get the page from support.microsoft.com at the top of the search results. If you want to capture the image of a graph for printing – you may prefer to check the Simple View box below the graph – this will remove the blue colour gradient and lilac coloured background and therefore may look better when printed (and certainly use less ink/toner).