![NOCI logo.png]](https://knowledge-software.noc-innovations.com/hs-fs/hubfs/NOCI%20logo.png?height=50&name=NOCI%20logo.png)
Formatting the Data When the tidal data is displayed in the output pane, you get a simple default layout of one tidal value per line (date, time and height separated by spaces). This is a simple format to understand but sometimes you may want to use the data in another piece of software such as Microsoft Excel. In this situation having the data as a comma separated values (CSV) file may be easier.
Poltips-4 therefore offers a number of different format options accessed by clicking the Format Text Output button. This will bring up the Format Text Output settings (see right) which will let you change some settings.
Layout: Select one of the options and you will see the layout in the output pane change as soon as you click confirm.
Date Format: Poltips provides different options for outputting the date. Options 1 and 2 are the most common UK formats whereas options 3 and 4 are useful to avoid confusion with people more familiar with the US date format.
Show the four main moon phases: Will output extra information to show the date on which the Moon reaches one of the four primary phases (new moon, first quarter, full moon, last quarter). The abbreviations used are:
- NM = new moon
- FQ = first quarter
- FM = full moon
- LQ = last quarter
- NO = not a primary moon phase (only appears on layout option 3)
A note about the one line per day CSV layout
This format works with any type of data (high and low waters, high waters only, low waters only or equal interval data) – the number of values per line will vary depending on the format.
Equal interval data only gives the date followed by the height values. No time information is included as this can be easily worked out. For example half-hourly interval data will have 48 height values corresponding to times of 00:00, 00:30, 01:00 … 23:30
For High and Low Water data you will usually see 3 or 4 tides on each line, with each tide given as a time followed by a height value.
For High Waters only, this format works slightly differently. It will usually output one or two tide values (time and height) per line but these are separated into morning and afternoon tides. Sometimes you will see extra commas to show that a particular tide is missing. Here's an example…
Location: LIVERPOOL (GLADSTONE DOCK) ; Datum: Chart Datum ; T-Zone: UTC ; Units: Metres Geographic Location: 53° 27' N ; 03° 01' W Moon's Phase: NM=New Moon, FQ=First Quarter, FM=Full Moon, LQ=Last Quarter, NO=Not a primary phase High Water Data only
01/01/2023,NO,06:32,7.76,18:52,8.11 02/01/2023,NO,07:38,7.83,19:57,8.10
07/01/2023,NO,11:23,8.88,23:42,8.68 08/01/2023,NO,11:57,8.94,,
09/01/2023,NO,00:17,8.68,12:30,8.94 22/01/2023,NO,11:18,9.65,23:48,9.52
23/01/2023,NO,,,12:07,9.91 24/01/2023,NO,00:36,9.59,12:54,9.99
25/01/2023,NO,01:23,9.48,13:40,9.89
On the 8/01/2023, there is only one HW, but there are two extra commas at the end of the line to show the 2 missing values (time and height) are missing from the afternoon.
On the 23/01/2023, there is also just one tide but this occurs in the afternoon. Therefore, the extra commas for the missing data occur between the Moon's phase and the afternoon tide time.
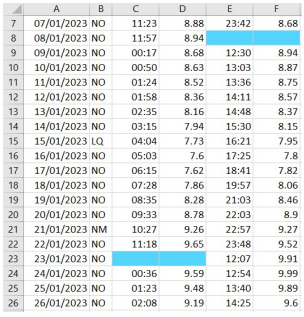
When you load the CSV file into Excel it looks like the picture below (you can see on the 23/01/2023 it has left two blank cells before the afternoon tide).
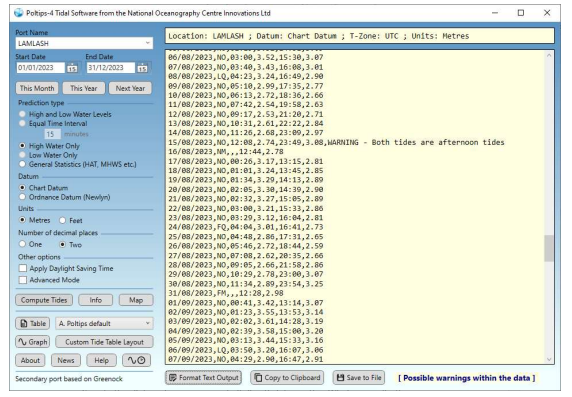
Warning – it is possible when computing HW only or LW only for both tides to appear in the morning or in the afternoon. In this situation it will just put the two tides in as normal but it will highlight this with a warning on that line of data. Since you might not know there is a warning when you can only see the first few lines of data a few things happen.
- The background colour of the output pane turns yellow
- A message appears below saying "Possible warnings within the data"
- If you scroll through the data, the line(s) with the warning(s) on should stand out quite easily Here's how Poltips-4 will look in this situation…
For further information see Poltips 4 user manual.