![NOCI logo.png]](https://knowledge-software.noc-innovations.com/hs-fs/hubfs/NOCI%20logo.png?height=50&name=NOCI%20logo.png)
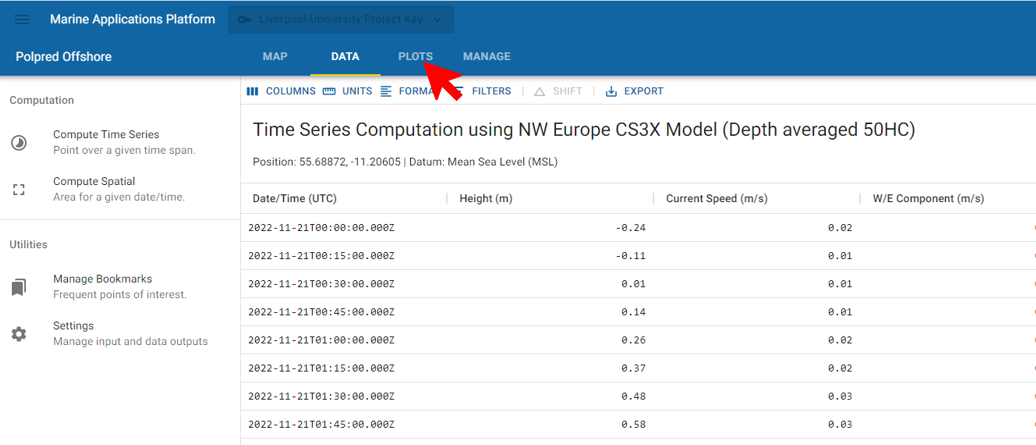
Having computed the data you require select 'PLOTS' from the top menu:
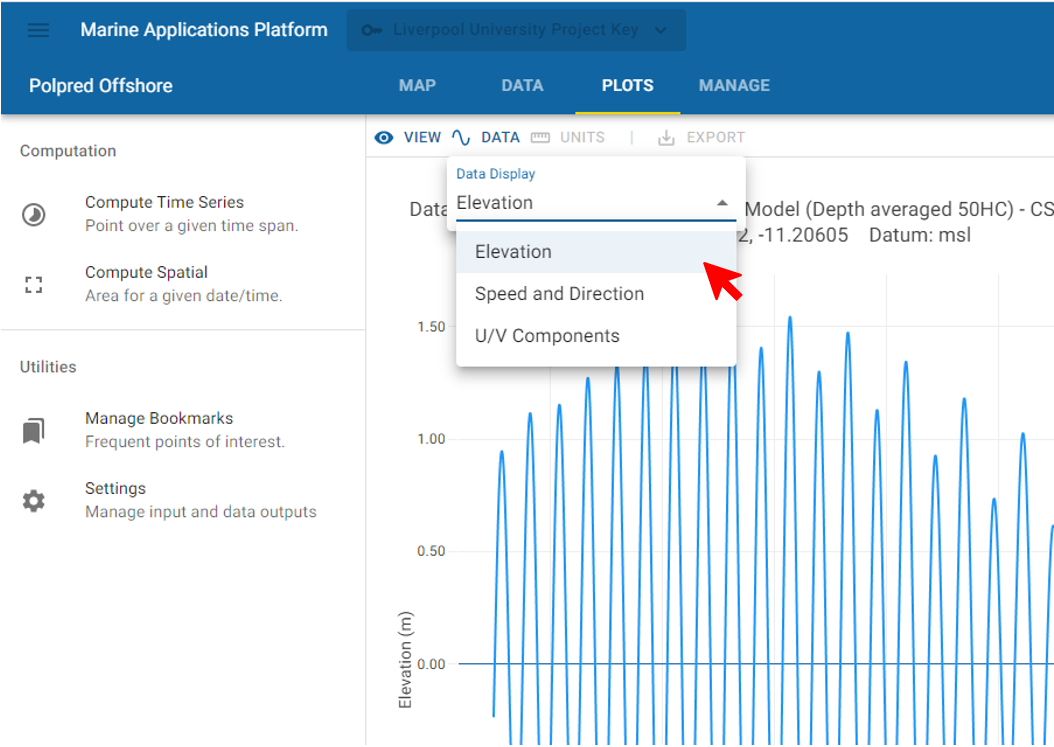
Choose 'Data' from the sub-menu below and then whether you wish to visualize elevation (or 'water level'), speed and direction or U/V components (current) data:
Each chart will display a set of icons on the right hand side as below:
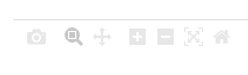
In order reading left to right these icons can be used as follows:-
- Click the camera icon
 to download a graphical file (png) of the chart for later import into other applications or programs.
 - Click the zoom icon
 to select a portion of the chart along the x axis and then zoom in to view that data set in more detail.
 - Click the pan icon
 to move along the data set backwards and forwards.
 - Use Zoom in and out
 to adjust the chart scale and view more detailed or less detailed data.
 - Autoscale
 will enable you to see all the data at once on the chart with a scale that fits the screen.
 - Use the home icon
 to reset axis after zooming in or out.
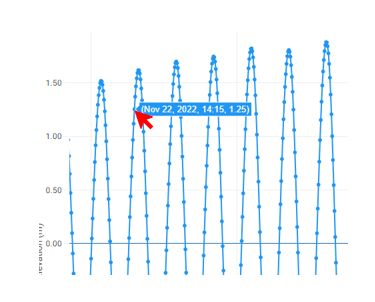
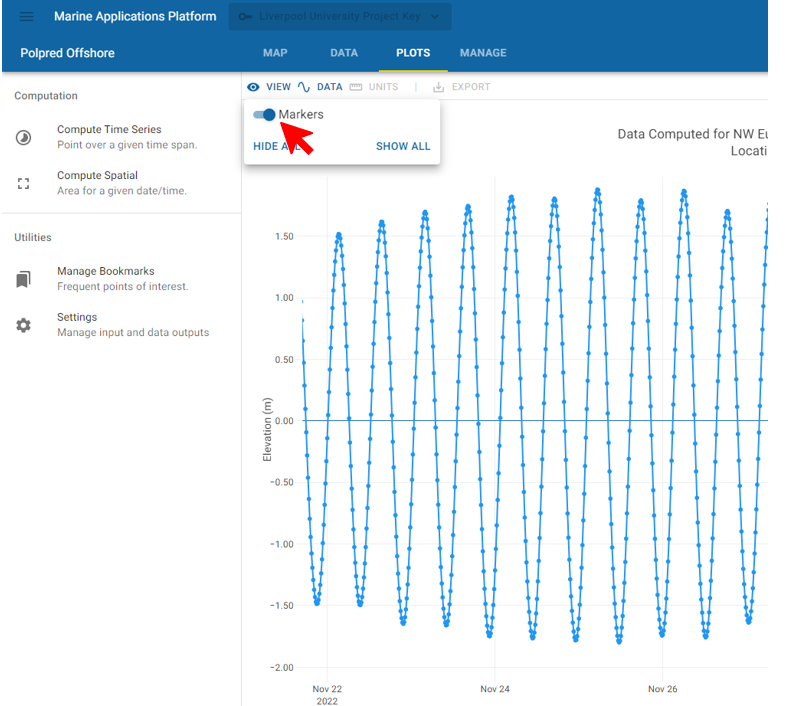
You can view the individual data points on your chart by selecting 'View' and then 'Markers' within the PLOTS submenu:-
Rolling your mouse pointer over a point will show the values at that point:-