![NOCI logo.png]](https://knowledge-software.noc-innovations.com/hs-fs/hubfs/NOCI%20logo.png?height=50&name=NOCI%20logo.png)
TASK (Tidal Analysis Software Kit) is a complete software solution for the harmonic analysis of data from tide gauges right through to the prediction of tides into the future and the production of formatted tide tables.
The original version of TASK was based on the harmonic analysis techniques developed at the National Oceanography Centre (then the Proudman Oceanographic Laboratory) and used throughout the world. However, being based on an old command line interface (DOS), it was clumsy to use and had limited internal quality control. This meant it was up to the tidal analyst to spot any potential problems with the data that could lead to errors in output with no assistance from the software.
TASK – Windows Edition is a completely new version of the software. There is little in common between TASK – Windows Edition, and TASK‐2000 other than the high‐precision and accuracy of the mathematical harmonic analysis engine and the name.
The Philosophy behind TASK – Windows Edition
- Produce a harmonic analysis package that is easy to use for both the experienced tidal analyst as well as newcomers to working with tidal data.
- Create software that is robust and configurable yet quick to get the results you need.
- Build in intelligence so it can assess its own results to see if they look sensible, and advise the analyst.
- Create a complete tide gauge to tide table solution.
- Provide a set of tools to be able to deal with problematic data.
- Create a documented workflow which can be followed to get consistent results.
- Create a professional product suitable for both commercial use and academic research.
- All files used and generated are plain text giving the user complete flexibility to choose their
own supplementary tools and integrate the software into existing systems.
The Approach
TASK is a suite of individual programs which, although they can be used independently, are designed in such a way that they work together in an integrated manner. The main components are:
- TASK – Windows Edition Use for launching the separate modules as required
- TASK – Toolkit For processing, resampling and QA of data
- TASK – DMT A separate data manipulation module
- TASK – Analyse The main harmonic analysis module
- TASK – Plot A plotting program for viewing data and quality control
- Poltips The Prediction Component with full tide table production
All programs are written to run under Microsoft Windows (XP, Vista, 7, 8, 10). Apple users will need to dual boot to Windows, use a Virtual Machine (e.g. VMWare Fusion) or Windows Emulation (e.g. CrossOver).
The Basic Workflow
- Get your data into a comma separated format (NOC‐CSV, UHSLC or TASK format). A basic
- level of knowledge in programs like Microsoft Excel makes this very easy.
- Run the data through TASK‐Toolkit which will carry out QA, resample the data if necessary
and convert it to the TASK file format (.t2k file). - View the TASK format file in TASK‐Plot if you wish for an initial quick visual scan of the data.
- Use TASK‐Analyse to carry out a harmonic analysis of the data. If you are happy with the
results you can select to have the Poltips prediction software automatically update so that
you are ready to produce fully formatted tide tables. - Alternatively check the data in the Plot module – it will show the tide gauge data along with a prediction made from the computed harmonics and the residual. You can flag any data that looks bad if you wish, save the file and reanalyse if necessary.
- Use Poltips to produce your finished tide table if required, or compute interval data, turning points, graphs etc. for any date and time period required (subject to your software licence).
A Few of the Features
- Reads in simple CSV file formats (including data directly downloaded from University of
- Hawaii Sea Level Centre)
- Native file format is plain text with tools for manipulation and checking. This format has a
data quality flag and supports 5 data channels (three are usually used for observation,
prediction and residual) - Data quality control is automatically carried out (e.g. gap detection, clock jumps). Potential
problems are highlighted with an advisory flag and the analyst can choose to include/exclude these in the analysis or manually inspect each one using TASK‐Graph. - Intelligent quality control in the analysis engine ‐ the software carries out hundreds of checks throughout the analysis process to see if the data looks sensible and the results it computes are reasonable.
- Data resampling and format conversion.
- Data manipulation can shift and scale data (Dnew = m.Dold + c ; m and c set by user).
- Time shifting to correct for time zone issues, daylight saving etc.
- Handles data in any time zone.
- TASK‐Plot gives you a simple visual tool to view the data (scrool and zoom easily) as well as
flag any data that you are not happy with that will then be excluded from the harmonic
analysis. - A selection of preset harmonic constant sets for different data lengths, but custom
configurable for the more experienced analyst. - Automatic calculation of daily, monthly and annual means if required.
- Sensible auto file naming and overwrite protection.
- Drag and drop input files from any file windows into the modules. Automatic blocking of data is done completely behind the scenes – no need to fill gaps.
- Over 100 harmonics if required.
- Quality control statistics are output as part of the analysis process.
- Poltips prediction software can produce complex tide table layout and graphs etc.
Complete integration means the TASK‐Analyse module will automatically update the
Poltips database and your new analysis results appear instantly in the list of ports. - Comprehensive documentation. E‐mail support for commercial and academic users.
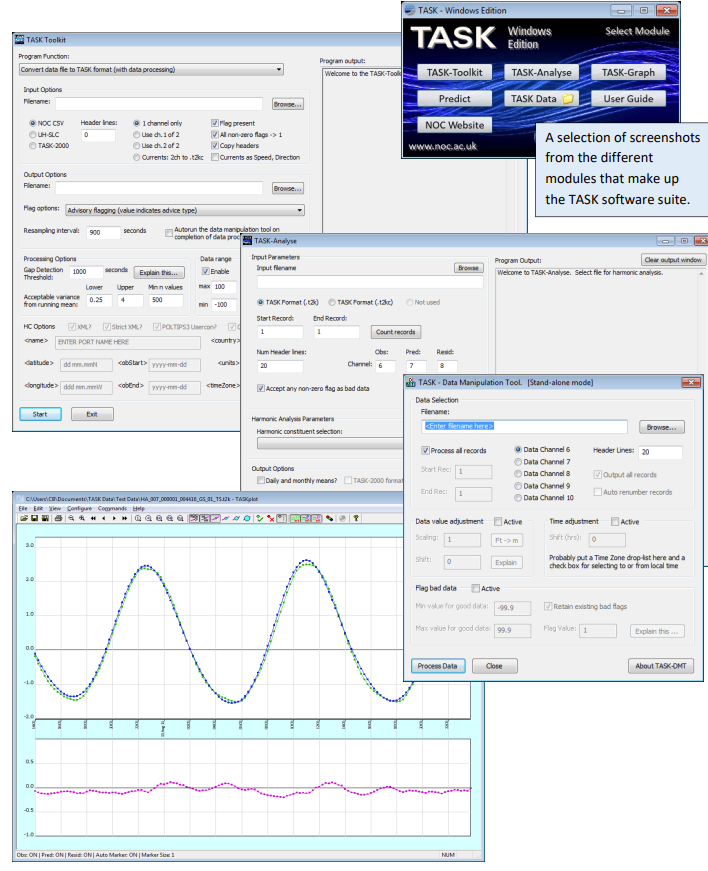
Screenshots